This article sets out the 2025 (January–December) sake export results published by the Japan Sake and Shochu Makers Association in February 2026, country by country. If you are considering sourcing Japanese sake, use it to see where your own market stands.
We have put the numbers in this article, together with the best-selling sake in Japan in 2026, into one free report (English, PDF, 12 pages). The country tables and charts can go straight into your internal planning documents.
2025 at a Glance
| Item | 2025 | vs 2024 |
|---|---|---|
| Export value | ¥45.9 billion | 106% |
| Export volume | 33,500 kL | 108% |
| Destination countries and regions | 81 (record high) | +1 |
| Export price per liter | ¥1,368 | 98% |
Source: Japan Sake and Shochu Makers Association, “2025 Sake Export Results”. Figures are rounded.
Despite the additional US tariffs, both value and volume grew on the previous year. Sake now reaches 81 countries and regions, the most ever.
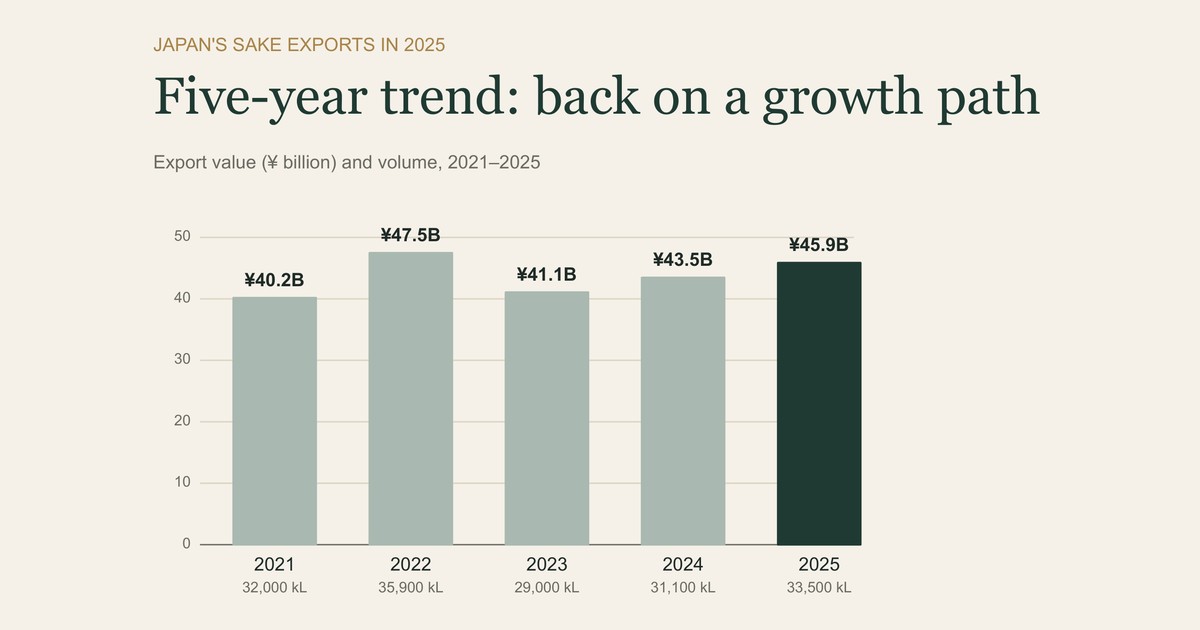
Five-Year Trend
| Year | Export value | Export volume |
|---|---|---|
| 2021 | ¥40.18 billion | 32,000 kL |
| 2022 | ¥47.49 billion | 36,000 kL |
| 2023 | ¥41.08 billion | 29,000 kL |
| 2024 | ¥43.47 billion | 31,000 kL |
| 2025 | ¥45.9 billion | 33,500 kL |
Sake Exports by Country and Region
| Market | Value | vs 2024 | Value rank | Volume | vs 2024 | Volume rank |
|---|---|---|---|---|---|---|
| China | ¥13.3 billion | 114% | 1 | 6,660 kL | 125% | 2 |
| United States | ¥11.0 billion | 97% | 2 | 7,720 kL | 97% | 1 |
| Hong Kong | ¥4.8 billion | 94% | 3 | 2,030 kL | 101% | 5 |
| South Korea | ¥4.4 billion | 117% | 4 | 5,483 kL | 112% | 3 |
| Taiwan | ¥2.7 billion | 101% | 5 | 3,035 kL | 105% | 4 |
| Singapore | ¥1.5 billion | 101% | 6 | 687 kL | 98% | 7 |
| Canada | ¥1.3 billion | 126% | 7 | 1,309 kL | 141% | 6 |
| Australia | ¥840 million | 108% | 8 | 654 kL | 97% | 8 |
| France | ¥630 million | 114% | 9 | 466 kL | 107% | 12 |
| United Kingdom | ¥620 million | 97% | 10 | 431 kL | 102% | 13 |
Source: Japan Sake and Shochu Makers Association, “2025 Sake Export Results” (export value and volume by country). Figures are rounded.
China ranks first by value and the United States first by volume. Together the two account for about half of all export value, and adding Hong Kong brings the top three to about 64%.
Export Price per Liter: Where Premium Sake Goes
The export price per liter is a guide to where higher-priced sake is being shipped. The order looks very different from the value and volume rankings.
| Rank | Market | Export price per liter |
|---|---|---|
| 1 | Macau | ¥3,058 |
| 2 | Hong Kong | ¥2,376 |
| 3 | Singapore | ¥2,190 |
| 4 | China | ¥1,998 |
| 5 | United Arab Emirates | ¥1,763 |
| 6 | United Kingdom | ¥1,432 |
| 7 | United States | ¥1,431 |
| 8 | France | ¥1,348 |
| 9 | Australia | ¥1,290 |
| 10 | Vietnam | ¥1,260 |
| All markets | ¥1,368 |
Source: Japan Sake and Shochu Makers Association, “2025 Sake Export Results” (export price per liter). The top 20 markets by export value, ranked here by price per liter.
Macau is about 2.2 times the overall average, Hong Kong about 1.7 times and Singapore about 1.6 times. These figures help you judge where premium sake is heading. South Korea, by contrast, is No. 3 by volume at ¥802 per liter, below the overall average.
Four Takeaways from the 2025 Numbers
1. The US Held at 97% of the Previous Year Under New Tariffs
Exports to the United States came to about 7,720 kL and about ¥11.0 billion, both about 97% of 2024. It was a year shaped by additional tariffs, yet the US remains the largest destination for Japanese sake by volume.
How tariffs feed into the landed price of sake is worked through step by step, from brewery price to shelf price, in our article on sake import costs.
2. South Korea Set Records in Both Value and Volume
Exports to South Korea reached about ¥4.4 billion (about 117% of 2024) and about 5,483 kL (about 112%), both all-time highs. By volume it is now the third-largest market, after the US and China.
South Korea also grew strongly in 2024, so this is a second consecutive year of growth. The 2024 picture is covered in our 2024 export trends article.
3. Canada and France Also Hit Records, and in France Sake Is Reaching Fine Dining
Canada and France both set records in value and volume. Canada reached about ¥1.3 billion (about 126% of 2024) and about 1,309 kL (about 141%), the largest volume growth among the top 20 markets. France reached about ¥630 million (about 114%) and about 466 kL (about 107%).
The Association points to more opportunities for sake in fine dining in France, meaning high-end restaurants outside Japanese cuisine. It is a sign that sake is moving from “a drink to pair with Japanese food” to “a drink listed alongside wine.”
4. The Price per Liter Has Risen About 1.8 Times in Ten Years
| Year | Export price per liter |
|---|---|
| 2015 | ¥771 |
| 2025 | ¥1,368 |
Since 2022 the export price has stayed between ¥1,300 and ¥1,400 per liter. In 2025 it was about 2% lower than the previous year, but about 1.8 times the level of ten years ago.
The growth of the past decade has come not only from larger volumes but from buyers choosing higher-priced sake.
If You Are Planning to Import Sake
These numbers help you check what stage your own market has reached.
- In large, established markets (the US, China, Hong Kong, South Korea), what sets you apart is carrying breweries and labels other importers do not.
- In every market, strict temperature control is how you set the same sake apart on quality. The same label can taste different on arrival depending on how it was shipped and stored.
- In markets that grew in 2025 (Canada, France and others), there is room to become a new name on restaurant lists.
Sakura Sake Shop exports sake from more than 70 breweries to more than 20 countries. Every shipment travels in reefer (refrigerated) containers, kept between -5°C and +5°C. Our approach to temperature is explained in Sake Storage Temperature: What Wine Importers Need to Know.
When you contact us, tell us your destination country, your sales channel (restaurants, retail and so on) and your target price range, and we can suggest sake that fits.
If you want to go through the import process from the beginning, start with How to Import Japanese Sake: 9 Simple Steps.
Statistics from Previous Years
About ¥45.9 billion, about 106% of the previous year, with volume of about 33,500 kL (about 108%). These are the January–December 2025 results published by the Japan Sake and Shochu Makers Association in February 2026.
China ranked first by value at about ¥13.3 billion, and the United States first by volume at about 7,720 kL. The US was second by value (about ¥11.0 billion) and China second by volume (about 6,660 kL).
81 countries and regions, a new record.
¥1,368 per liter in 2025, about 1.8 times the ¥771 of 2015. Hong Kong, Singapore and Macau are above ¥2,000 per liter.
Among the top 20 markets by export value, Macau is the highest at ¥3,058 per liter, followed by Hong Kong (¥2,376) and Singapore (¥2,190).
South Korea, Canada and France set records in both value and volume. South Korea grew to about 117% of 2024 in value and about 112% in volume. China also grew, to about 114% in value and about 125% in volume.
Yes. We handle reefer containers and temperature-controlled transport. Even with expensive premium sake, you can import without worry.
Planning your 2026 sourcing? Start with the market data.
We have put Japan's 2025 sake exports by country and the best-selling sake in Japan in 2026 into one free report (English, PDF, 12 pages).
✓ Value and volume for the top 10 export markets, with year-on-year change
✓ Export price per liter by market, the five-year trend and four takeaways for importers
✓ The top 10 best-selling sake at our online store in Japan, linked to the export product pages